Nobody doubts equities when markets are on a tear. Some of us do our homework and choose mutual funds (MFs) that are most suitable for our goals. But some jump into the pool even if they don’t know how to swim. The knives are out when markets tumble. When equity markets collapsed this March, obituaries were written for equities. Returns from equity fund investments made through systematic investment plan (SIP) too were hurt; returns from even 10-year SIPs looked anaemic after the market crash.
This begs the question: Do SIPs work? As we pick up the pieces after the equity market crash it’s good to check if SIPs still deliver as they are expected to.
The other question in the minds of many investors is this: What is long-term? How long should I remain invested for earning a reasonable return? And can long-term eliminate losses?
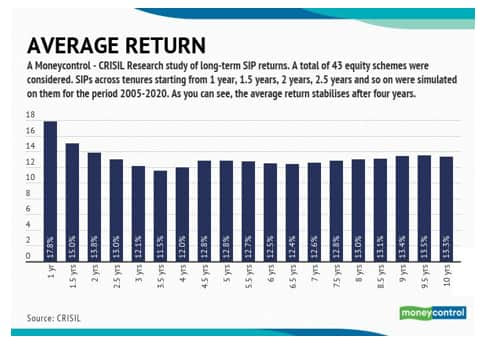
To answer these questions, Moneycontrol tied up with CRISIL Research to crunch the numbers and data pertaining to returns over many years to analyse if equity fund SIPs have indeed delivered. The study shows how SIPs contained losses in falls and participated in rallies. Finally, the study also aimed to determine if your chances of making losses go down as your SIP tenure increases.
Making sense of the data
We ran multiple SIPs between January 2005 and March 2020. That’s 15 years’ data. Why 2005? Because a 15-year time horizon is long enough to get enough number of SIPs of varying tenures starting from a year’s worth of SIP to a 10-year SIP. A 10-year SIP, for instance, gave us 65 data points for each of the schemes considered, which are good enough to get an average. We could have gone further into the past, but that would have resulted in more schemes getting eliminated.
We took time horizons from one year, 1.5 years, two years, 2.5 years and so on till a maximum time period of 10 years. For instance, a one-year SIP started on January 3 would end on January 2, 2006. A two-year SIP started on January 3, 2005, would end on till January 2, 2007, and so on. SIPs across all time periods are assumed to have been done with a monthly frequency. Take the case of Nippon India Growth Fund. The first one-year SIP started on January 3, 2005, and ended on January 2, 2006. The second one-year SIP started on February 1, 2005, and ended on February 1, 2006. A total of 173 one-year time periods were considered here and for other schemes’ one-year SIPs.
Picking from the diversified pack
We took 43 equity schemes and only stuck to large-caps, multi-caps, mid-caps and tax-savings equity funds (ELSS). The idea was to take schemes that are as diversified as possible. But all these schemes had to be in existence as on January 1, 2005. That is also why, in this study, many prominent equity schemes from small and mid-sized ones were left out because they were launched much later – Mirae Asset, Motilal Oswal and Quantum MFs.
Only growth option schemes have been considered for this study.
Let’s take a look at some of the finer points of the study and also ways in which you can avoid the classic looking-at-the-rear-view-mirror traps and maximise your wealth instead.
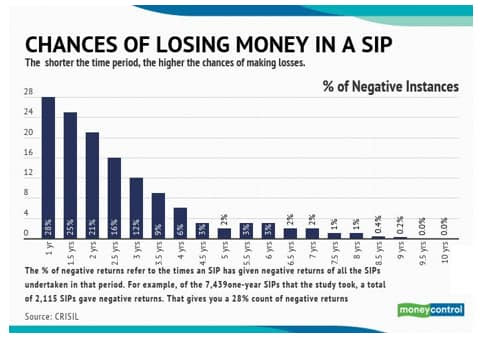
-The shorter the time periods, the more the chances of you losing money in an SIP. Over a one-year time horizon, 28 percent of SIPs gave negative returns. As you increase your tenure, the probability of making losses diminishes. SIPs run for four years have given negative returns just six percent of the times.
-Equities are volatile in the short run. You have a chance to make a lot of money, but you could also lose a lot. The maximum one-year SIP return was 184 percent – the most in any tenure considered for this study. But the worst return of all SIPs across all tenures also came in a one-year SIP, -88.2 percent.
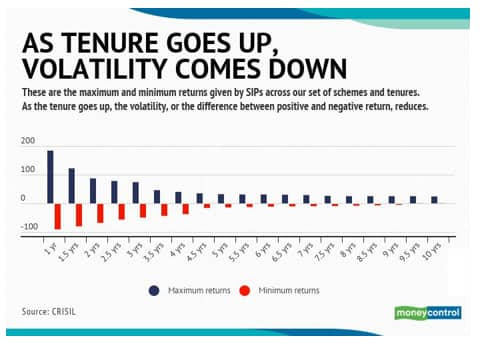
-Take the case of Taurus Large cap Fund. Its maximum two-year SIP return was 62 percent. But its worst two-year SIP return was -50 percent.
-The maximum and minimum returns converge as the tenure expands. Put another way, the volatility reduces as the tenure goes up. The maximum returns from SIPs carried out over 7.5 to 10 years is around 25 percent. The worst return goes down from a loss of around eight percent for a 7-year SIP to about 0.7 percent for a 10-year SIP.
-How long should you run a SIP to ensure you don’t make a loss at all? As per our study, the probability of making losses goes down to zero if you stayed invested – across any scheme you chose – in an SIP for at least 9.5 years. CRISIL says that this time period was nine years in a similar study done in November 2017.
-As expected, large-cap funds are the least risky of all. The probability of negative returns goes down to zero from 8.5 years, as opposed to the overall equity fund universe’s average of 9.5 years.
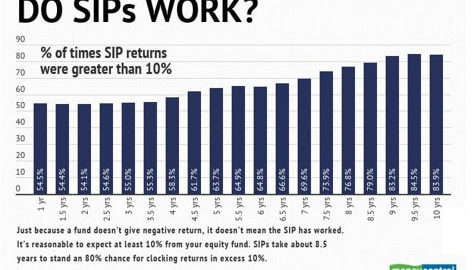
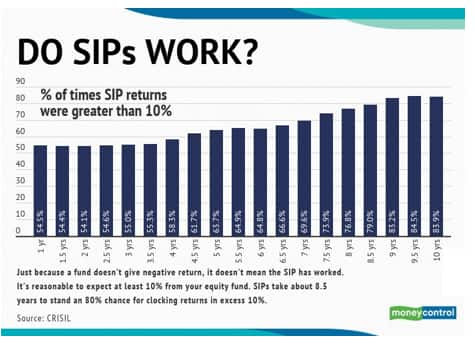
-And now the big question: Do SIPs work? Just because your SIP doesn’t give negative returns, it doesn’t mean you’ve hit a winner. It has to deliver reasonable returns, preferably more than fixed deposits to justify the equity risk. Expecting 10 percent return from equities is reasonable. How many times have SIPs returned more than 10 percent? Nearly 80 percent of the SIPs run over seven-and-a-half years have given more than 10 percent returns. Nearly 84 percent of SIPs run across 10-year time periods have given returns in excess of 10 percent. That’s still a worrying 16 percent of SIPs that have not even given 10 percent returns over a 10-year period.
-Curiously, 98 percent of the mid-cap funds gave returns in excess of 10 percent over a 10-year SIP period. This shows that, over a long period, taking slightly higher risks actually works.
To conclude, the study has two minor caveats. It is based on a limited set of funds. And it is based on past data; no one can predict future returns. The important thing to remember here is that the probability of making losses go down as you increase your investment horizon.
This article is published on Moneycontrol under subscriptions, posted here with the due right for our reader.